Quality control
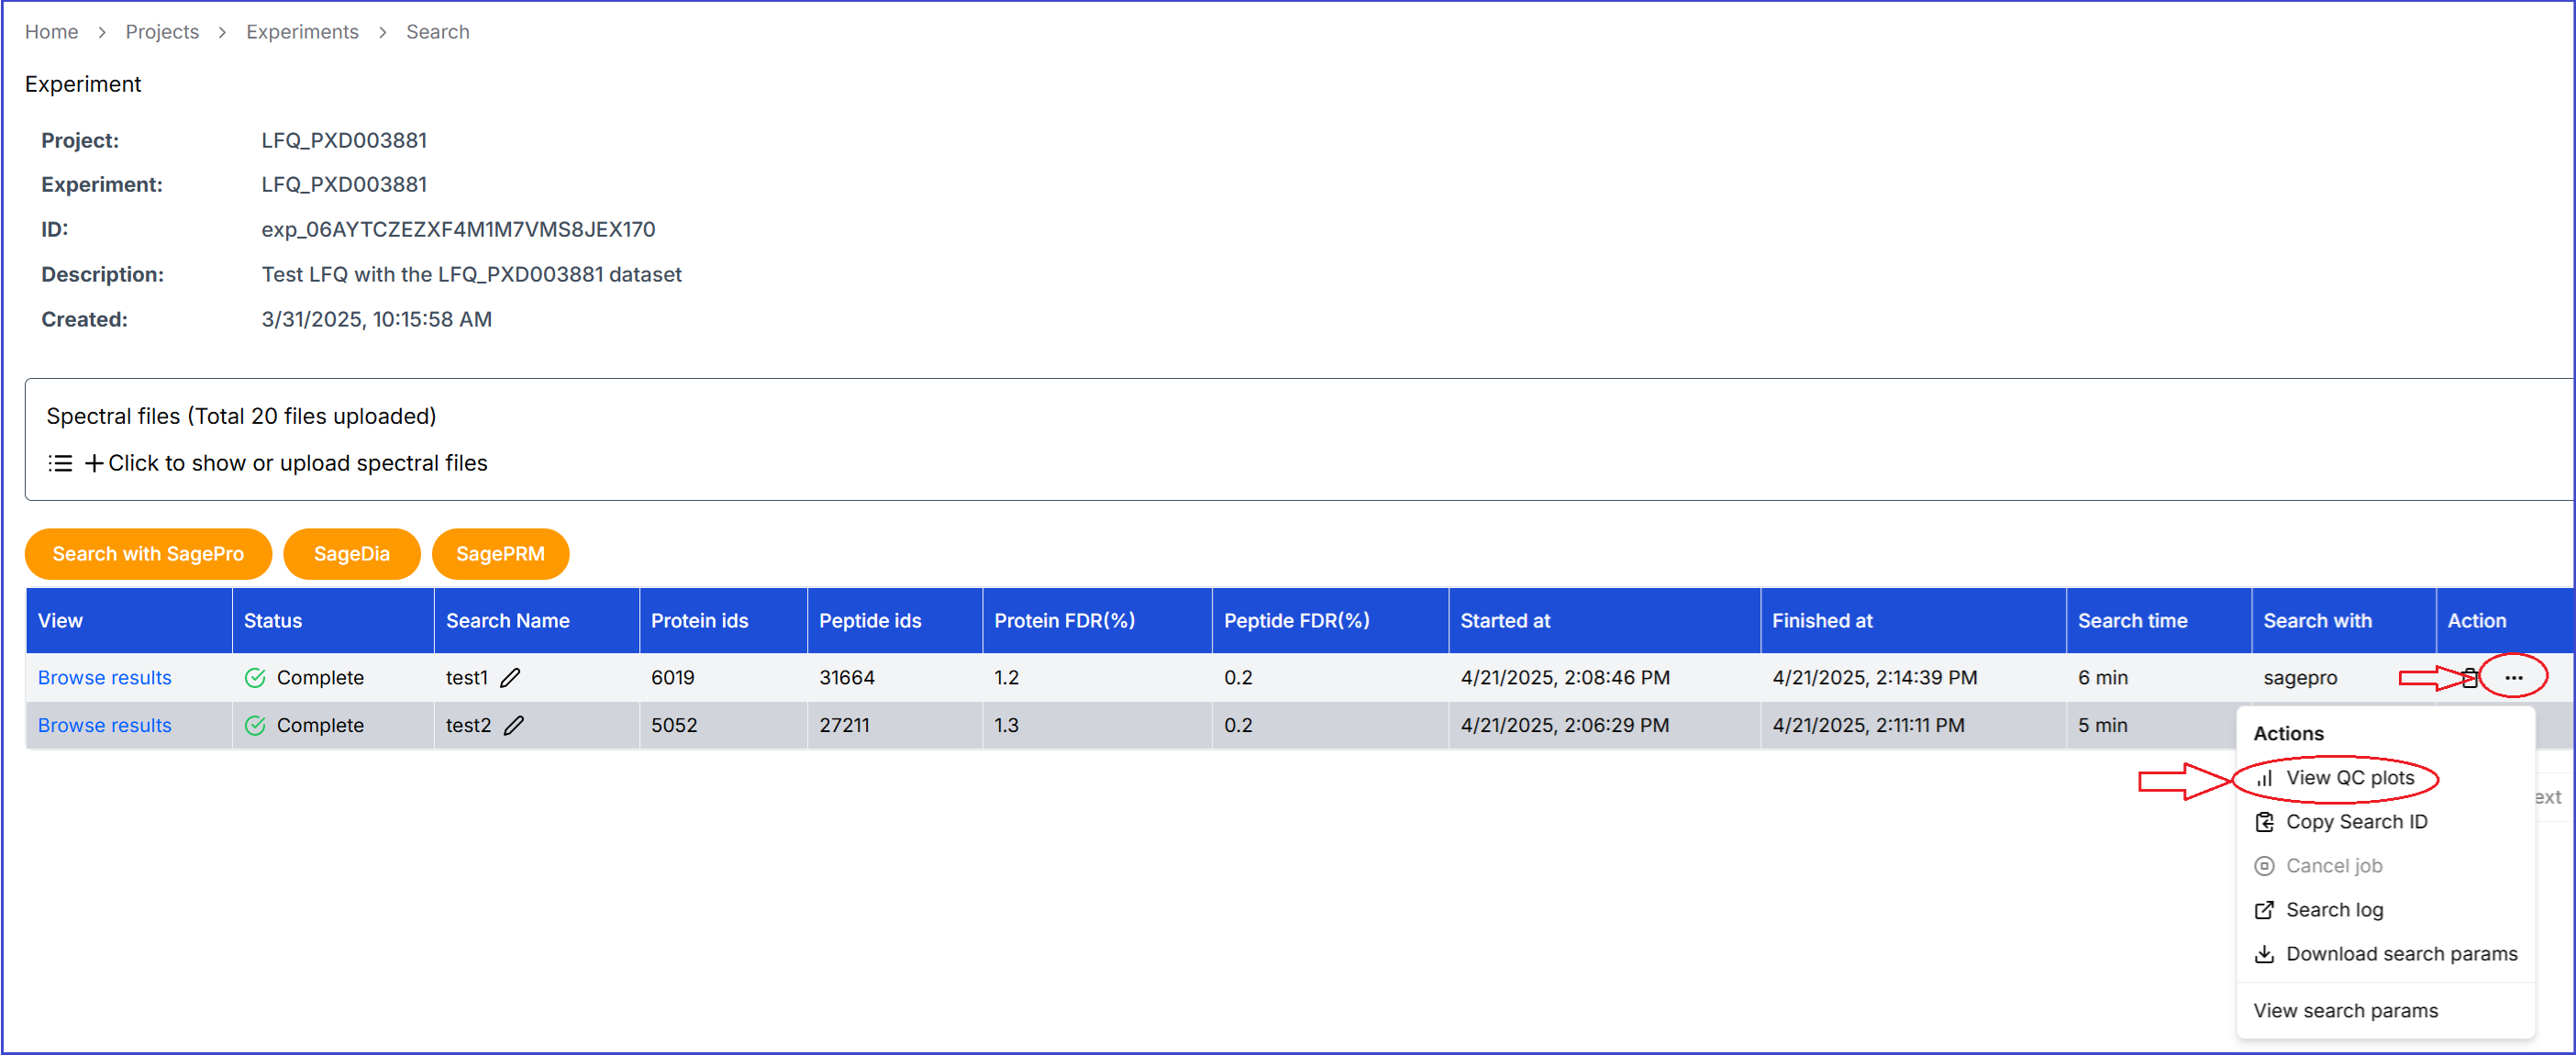
Click on a project and then click an experiment. In the Action column of a search, click on '...' and then select the 'View QC Plots' menu.
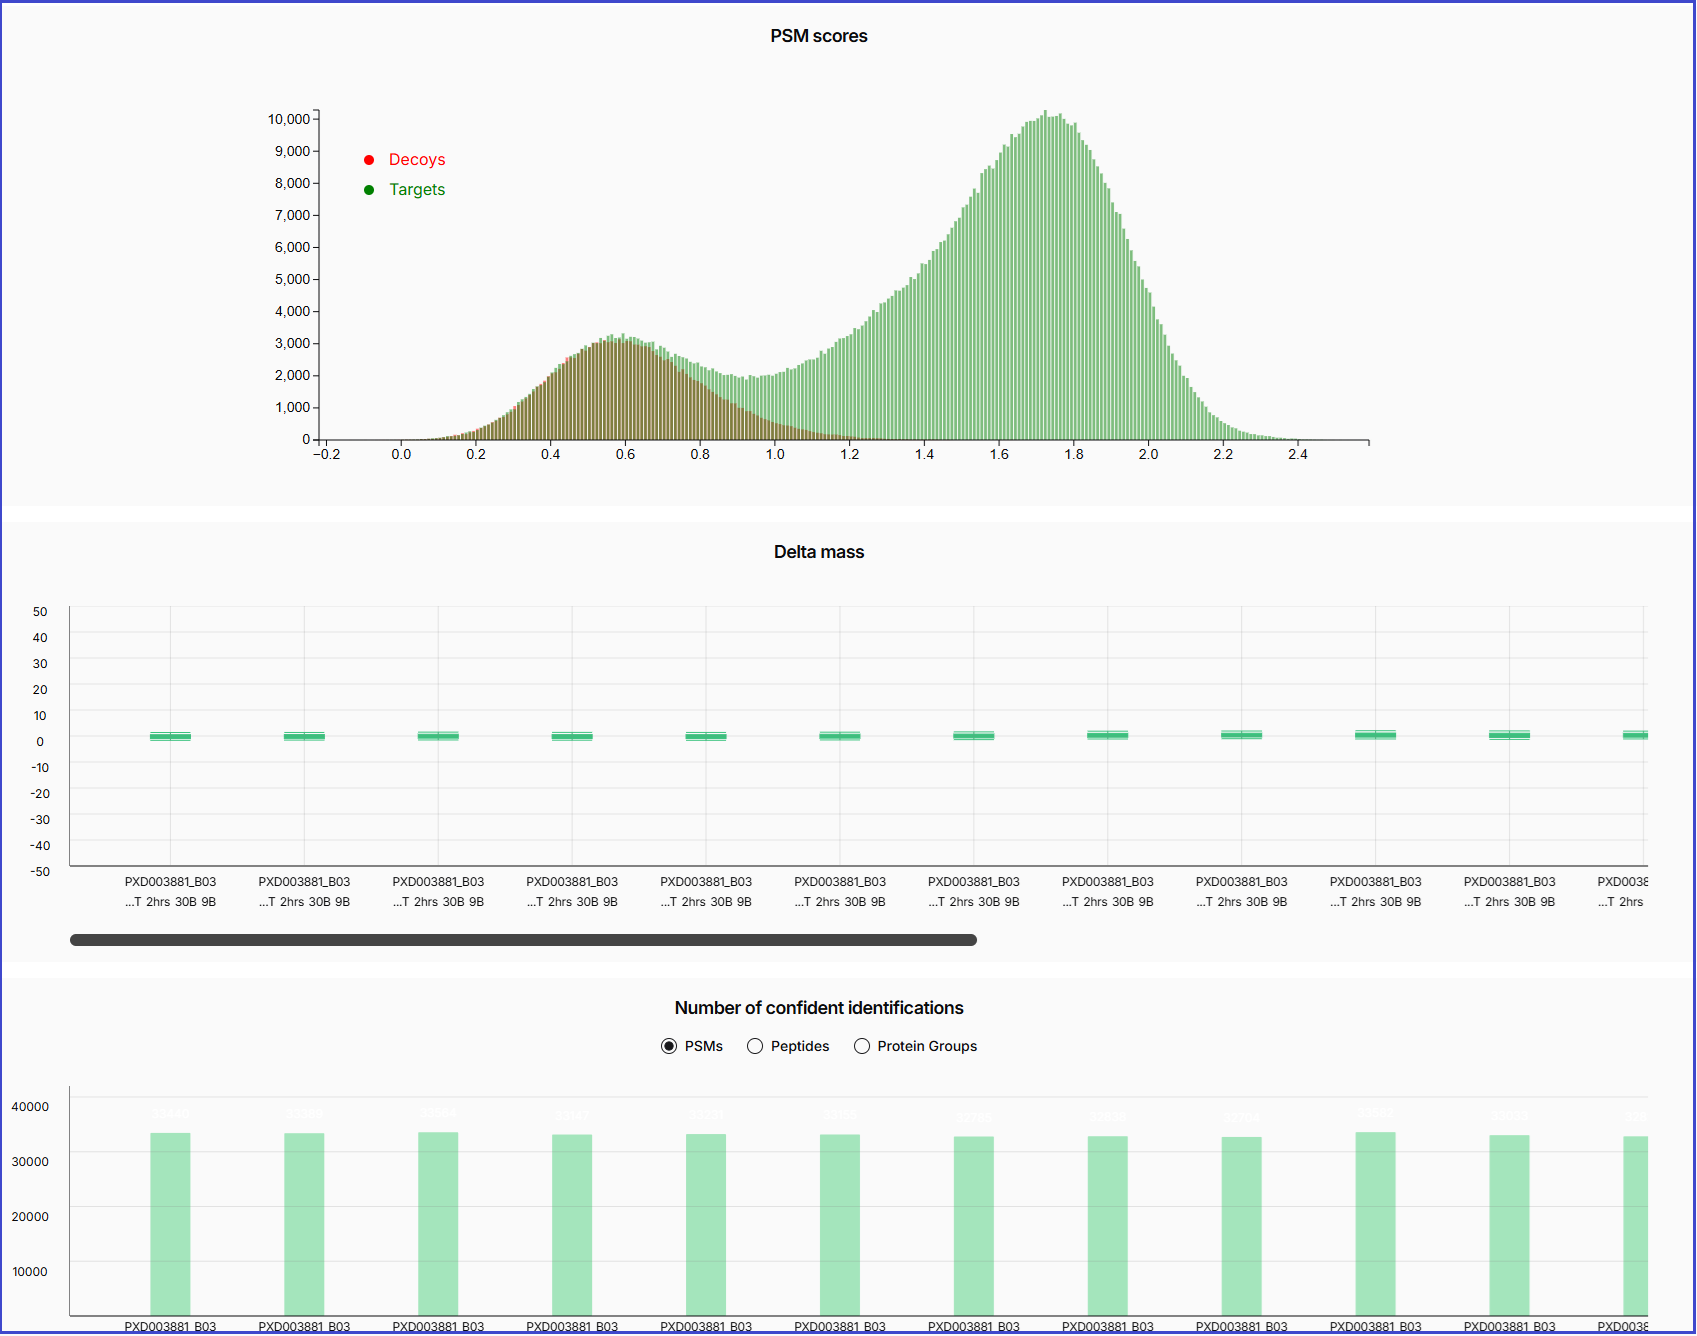
After click 'View QC Plots', the QC plot will display the distributions of the PSM scores of the decoy and target hits, as well as the delta mass and number of confident identifications in each sample or spectral file.